
Latest CPCB data shows that the no. of critically polluted river stretches is on the rise
 Published on Oct 9, 2018
 Modified on Jun 14, 2021
|
How clean are our rivers? Latest data indicates a negative trend. A report by the Central Pollution Control Board (CPCB), which was released in September this year, reveals that in total there were 45 river stretches across the country in 2016-17, where water quality is found to be the worst. In 2014-15, however, the total number of such river stretches was just 34. Technically speaking, the value of biochemical oxygen demand (BOD) of the water flowing in these river stretches exceeds 30 milligram (mg) per litre (l). For example, the maximum value of BOD of water found in the Yamuna river stretch between Wazirabad and Asgarpur ranges from 9 mg/l to 80 mg/l, according to the new CPCB report. The latest report indicates that there were 16 river stretches across the country in 2016-17, where the BOD value is reported to be between 20 mg/l and 30 mg/l. It has been observed that there were 43 river stretches, where the BOD value of water is between 10 mg/l and 20mg/l, although in 72 river stretches, the BOD value is between 6 mg/l and 10 mg/l. The CPCB has found that in 175 river stretches, the BOD value of water is between 3 mg/l and 6 mg/l. Please consult table-1 for details. Table 1: Priority-wise number of polluted river stretches as per 2015 and 2018 CPCB reports 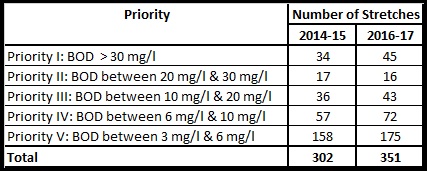 Source: River Stretches for Restoration of Water Quality: State-wise and Priority-wise, CPCB, September, 2018, please click here to access River Stretches for Restoration of Water Quality, CPCB, February, 2015, please click here to access --- It could be seen from table-1 that the total number of critically polluted river stretches has increased from 302 to 351 between 2014-15 and 2016-17. The total number of river stretches, where the BOD value exceeds 30 mg/l, has increased from 34 to 45 over this time span, as already mentioned above. The latest CPCB report, which is based on statistical analysis of water quality data under the National Water Quality Monitoring Programme for 2016-17, says that in 31 states and Union Territories (UTs) rivers and streams have not met water quality standards. Maharashtra (53) has the highest number of polluted river stretches (from Priority-I to Priority-V), followed by Assam (44), Madhya Pradesh (22), Kerala (21), and Gujarat (20). Please check table-2 for details. The highest number of river stretches, where water quality is the worst in terms of BOD value (viz. greater than 30 mg/l that falls under Priority-I), is found in Maharashtra (9), followed by Gujarat (5), Tamil Nadu & Uttar Pradesh (both 4), Assam, Madhya Pradesh & Uttarakhand (3 each) and Haryana, Meghalaya & Punjab (2 each). Table 2: State-wise & priority-wise number of polluted river stretches  Source: River Stretches for Restoration of Water Quality: State-wise and Priority-wise, CPCB, September, 2018, please click here to access
Biochemical Oxygen Demand (BOD), Encyclopaedia Britannica, please click here to access (accessed on 8th October, 2018)
Image Courtesy: UNDP India |
Tagged with: Biochemical Oxygen Demand (BOD) Central Pollution Control Board Central Pollution Control Board (CPCB) Dissolved Oxygen Concentration River Water Pollution Water Pollution


Write Comments