No, we can't compare Global Hunger Index rankings between two reports
Like last year, this year too journalists and media persons have compared India's Global Hunger Index (GHI) ranking vis-à-vis its position in previous years. Even the social media is buzzing with commentaries on the fallen GHI ranking of the country. The question remains whether such a comparison is possible.
The newly released report entitled 2018 Global Hunger Index: Forced Migration and Hunger clearly says that the GHI scores are comparable within each year’s report, but not between different years’ reports. Therefore, in the case of the present report, the 2018 GHI scores can be directly compared with the GHI scores given for three reference years — 2000, 2005, and 2010 — in the same report.
It could be found from the recent report that the GHI score for India has reduced over time viz. its GHI score was 38.8 in both 2000 (data from the period 1998-2002) and 2005 (data from the period 2003-2007), 32.2 in 2010 (data from the period 2008-2012) and 31.1 in 2018 (data from the period 2013-2017). In comparison to India, South Asia's GHI score was 38.4 in 2000, 37.6 in 2005, 32.3 in 2010 and 30.5 in 2018. Please check interactive chart-1 for details.
In terms of GHI in 2018, India ranks 103rd (GHI score: 31.1), China 25th (GHI score: 7.6), Sri Lanka 67th (GHI score: 17.9), Myanmar 68th (GHI score: 20.1), Nepal 72nd (GHI score: 21.2), Bangladesh 86th (GHI score: 26.1), Pakistan 106th (GHI score: 32.6) and Afghanistan 111th (GHI score: 34.3) among 119 countries.
The 2018 GHI report, which has been brought out by Welthungerhilfe and Concern Worldwide jointly, says that the GHI score ranges between zero and 100, where 0 is the best score (no hunger) and 100 is the worst.
Why can't GHI scores and indicator values apart from GHI rankings be compared between reports?
The GHI scores, which are based on current and historical data, are being revised and improved continually by the United Nations agencies that compile them. Such changes in data are incorporated in each year's GHI report. Due to data revision and updating, the GHI scores between the reports might change, which may give the false impression that hunger has reduced or increased for a particular country. Besides, due to change in the methodology for calculating GHI scores, it is not correct to compare GHI scores between reports. The present report says that like the GHI scores and indicator values, the rankings from one year’s report cannot be compared to those from another. Owing to the inclusion or exclusion of countries in each year's report depending on the availability of data, apart from change in the ranking system in the past, GHI rankings between reports cannot be compared.
Since 2015, the GHI scores are calculated based on four indicators i.e.
-- Undernourishment: the share of the population that is undernourished (that is, whose caloric intake is insufficient);
-- Child Wasting: the share of children under the age of five who are wasted (that is, who have low weight for their height, reflecting acute undernutrition);
-- Child Stunting: the share of children under the age of five who are stunted (that is, who have low height for their age, reflecting chronic undernutrition); and
-- Child Mortality: the mortality rate of children under the age of five (in part, a reflection of the fatal mix of inadequate nutrition and unhealthy environments).
It needs to be mentioned here that each of the four component indicators mentioned above is given a standardized score on a 100-point scale based on the highest observed level for the indicator on a global scale in recent decades. Then, the standardized scores are aggregated so as to calculate the GHI score for each country, with each of the three dimensions (inadequate food supply; child mortality; and child undernutrition, which is composed equally of child stunting and child wasting) given equal weight, says the 2018 GHI report.
Undernourishment
It could be observed from the interactive chart-2 that the proportion of undernourished in the population for India was 18.2 percent during 1999-2001, 22.2 percent during 2004-2006, 17.5 percent during 2009-2011 and 14.8 percent during 2015-2017. In contrast, the proportion of undernourished in the population for China was 15.9 percent during 1999-2001, 15.2 percent during 2004-2006, 11.8 percent during 2009-2011 and 8.7 percent during 2015-2017.
Wasting
From the interactive chart-3 it could be seen that the proportion of children under the age of five who are wasted (viz. too thin for height) for India was 17.1 percent during 1998-2002, 20.0 percent during 2003-2007, 16.7 percent during 2008-2012 and 21.0 percent during 2013-2017. In contrast, the proportion of children under the age of five who are wasted for China was 2.5 percent during 1998-2002, 2.9 percent during 2003-2007, 2.3 percent during 2008-2012 and 1.9 percent during 2013-2017.
Stunting
From the interactive chart-4 it could be noticed that the proportion of children under the age of five who are stunted (viz. too short for age) for India was 54.2 percent during 1998-2002, 47.9 percent during 2003-2007, 42.2 percent during 2008-2012 and 38.4 percent during 2013-2017. In contrast, the proportion of children under the age of five who are stunted for China was 17.8 percent during 1998-2002, 11.7 percent during 2003-2007, 9.4 percent during 2008-2012 and 8.1 percent during 2013-2017.
One could discern from the interactive table-1 that the under-five mortality rate for India was 9.2 percent in 2000, 7.4 percent in 2005, 5.9 percent in 2010 and 4.3 percent in 2016. In contrast, the under-five mortality rate for China was 3.7 percent in 2000, 2.4 percent in 2005, 1.6 percent in 2010 and 1.0 percent in 2016.
Table 1: Under-five mortality rate (in percent) as per 2018 GHI report
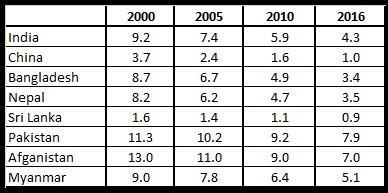
Source: 2018 GHI report, please click here to access
The key findings of the report entitled 2018 Global Hunger Index: Forced Migration and Hunger, which was released in October 2018, are as follows:
• During 2018 India ranked 103rd among 119 countries in terms of Global Hunger Index (GHI).
• Neighbouring countries such as China (GHI score: 7.6; GHI rank: 25), Nepal (GHI score: 21.2; GHI rank: 72), Myanmar (GHI score: 20.1; GHI rank: 68), Sri Lanka (GHI score: 17.9; GHI rank: 67) and Bangladesh (GHI score: 26.1; GHI rank: 86) have outperformed India (GHI score: 31.1; GHI rank: 103). However, Pakistan (GHI score: 32.6; GHI rank: 106) and Afghanistan (GHI score: 34.3; GHI rank: 111) have performed worse than India.
• GHI score was 38.8 in both 2000 (data from the period 1998-2002) and 2005 (data from the period 2003-07), 32.2 in 2010 (data from the period 2008-12) and 31.1 in 2018 (data from the period 2013-17).
• At 31.1, the country's 2018 GHI score falls in the serious category, says the report.
• The indicators i.e. prevalence of stunting in children under five years (in percent) and under-five mortality rate (in percent) have exhibited clear-cut declining trends over time. The prevalence of wasting in children under five years (in percent) has increased from 16.7 percent during 2008-12 to 21.0 percent during 2013-17.
• The proportion of undernourished in the population for India was 18.2 percent during 1999-2001, 22.2 percent during 2004-2006, 17.5 percent during 2009-2011 and 14.8 percent during 2015-2017.
• The proportion of children under the age of five who are wasted (viz. too thin for height) for India was 17.1 percent during 1998-2002, 20.0 percent during 2003-2007, 16.7 percent during 2008-2012 and 21.0 percent during 2013-2017.
• The proportion of children under the age of five who are stunted (viz. too short for age) for India was 54.2 percent during 1998-2002, 47.9 percent during 2003-2007, 42.2 percent during 2008-2012 and 38.4 percent during 2013-2017.
• The under-five mortality rate for India was 9.2 percent in 2000, 7.4 percent in 2005, 5.9 percent in 2010 and 4.3 percent in 2016.
• The child wasting rate for the South Asia region is amplified in part by that of India, which has the region’s largest population and highest level of child wasting, at 21.0 percent according to the latest data. Yet even without India, South Asia’s child wasting rate would top the rates of the other regions of the world.
• Wasting is most prevalent in Djibouti, India, and South Sudan, but even among these three countries the rates and estimates vary widely, at 16.7 percent, 21.0 percent, and 28.6 percent, respectively.
References
2018 Global Hunger Index: Forced Migration and Hunger, Welthungerhilfe and Concern Worldwide, please click here to access
Synopsis of 2018 Global Hunger Index: Forced Migration and Hunger, Welthungerhilfe and Concern Worldwide, please click here to access
Hunger deaths have skyrocketed after aadhaar-based authentication came into force, allege right to food activists, News alert by Inclusive Media for Change dated 1st October, 2018, please click here to access
Despite having a food security legislation, spending on food subsidy is low, News alert by Inclusive Media for Change dated 31st January, 2018, please click here to access
India's hunger ranking affected by wasting among children, depicts new report, News alert by Inclusive Media for Change dated 13th October, 2017, please click here to access
Image Courtesy: UNDP India